
Sentiment analysis is a great way to take advantage of open-source technology in order to develop private research. In this project I automated a web-scraper that fetched COVID-19 and climate change headings from google news during 30 consecutive days. By studying what language is employed, I hope to get a glimpse of what is the current attitude about these topics. Platonically, this would be the first step in a longitudinal study that could potentially track the changing attitudes of people about climate change as we start overcoming the pandemic. By doing this, I presume that the language used in google news is associated with the attitudes of the general population who has access to the internet.
Sentiment analysis (also known as opinion mining or emotion AI) is the use of natural language processing, text analysis, computational linguistics, and biometrics to systematically identify, extract, quantify, and study affective states and subjective information.
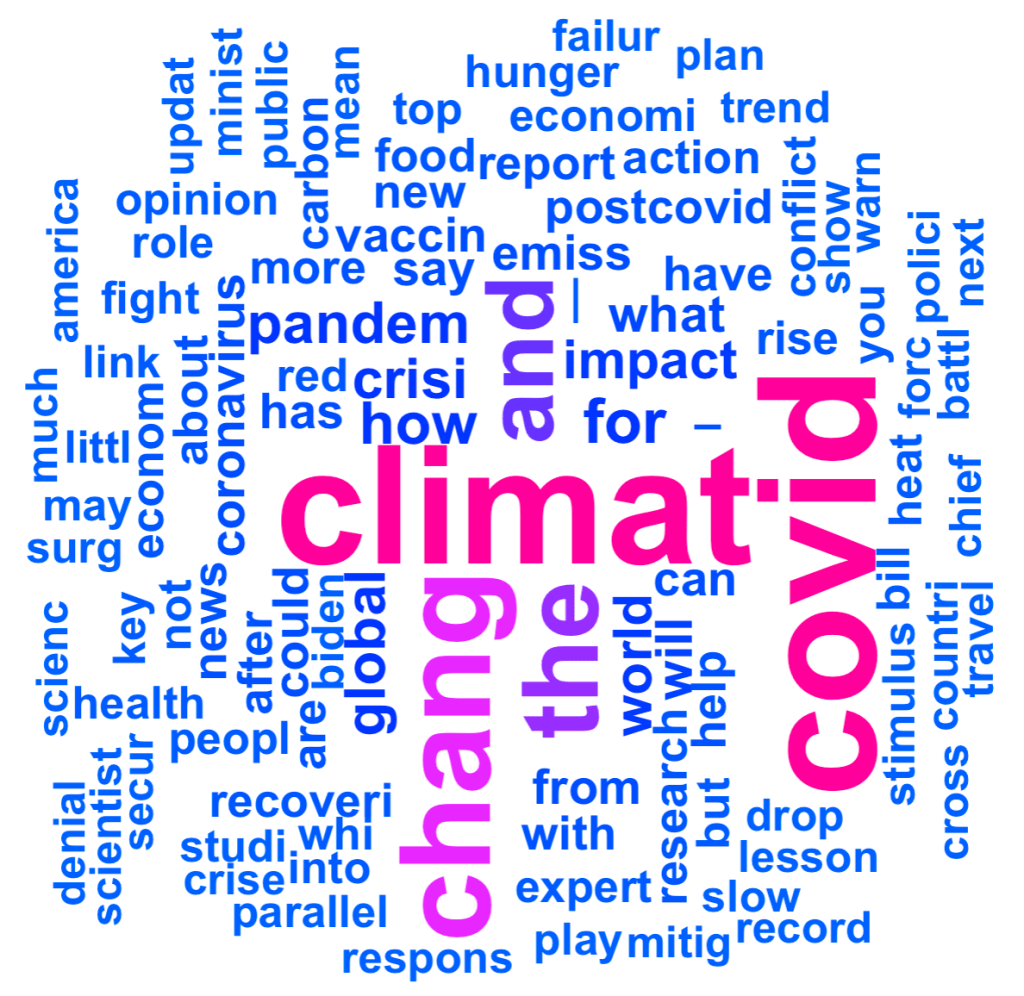
I hope that after briefly seeing the figure above, you were able to notice that most of the words are spelled wrong. This is because it is a word cloud engineered from the data mined from google news, showing the top 100 stem words with the highest instances. This syntax is best explained through examples. Take the words ‘fishing’, ‘fish’ and ‘fisherman’, where if they were to be ran through sentiment analysis, they would be reduced to its root or stem word, which is just fish. This is critical since we want to avoid repeating similar words that transmit a similar meaning.
In English grammar and morphology, a stem is the form of a word before any inflectional affixes are added. In English, most stems also qualify as words. The term base is commonly used by linguists to refer to any stem (or root) to which an affix is attached.
Before debriefing some of my findings, it is important to expand more on what sentiment analysis does to the text data we gathered. As the English language has been highly studied, people have been able to categorize a lot of words into 8 emotions (anger, anticipation, disgust, fear, joy, sadness, surprise and trust). All we really have to do it count how many words are in each category. There is obviously some limitations to this methodology, as we can use combinations of words to transmit a message that is different from their individual meaning. Once again I think this is better explained through examples, such as “It is a good thing that [name] is not a president anymore”. If we were to fetch news about [name] as a president, our algorithm would categorize that sentence under a positive light as it used the word ‘good’, although that does not match the meaning of the whole sentence. Regardless, I believe that sentiment analysis can still be used to find the overall attitude of a subject of study.

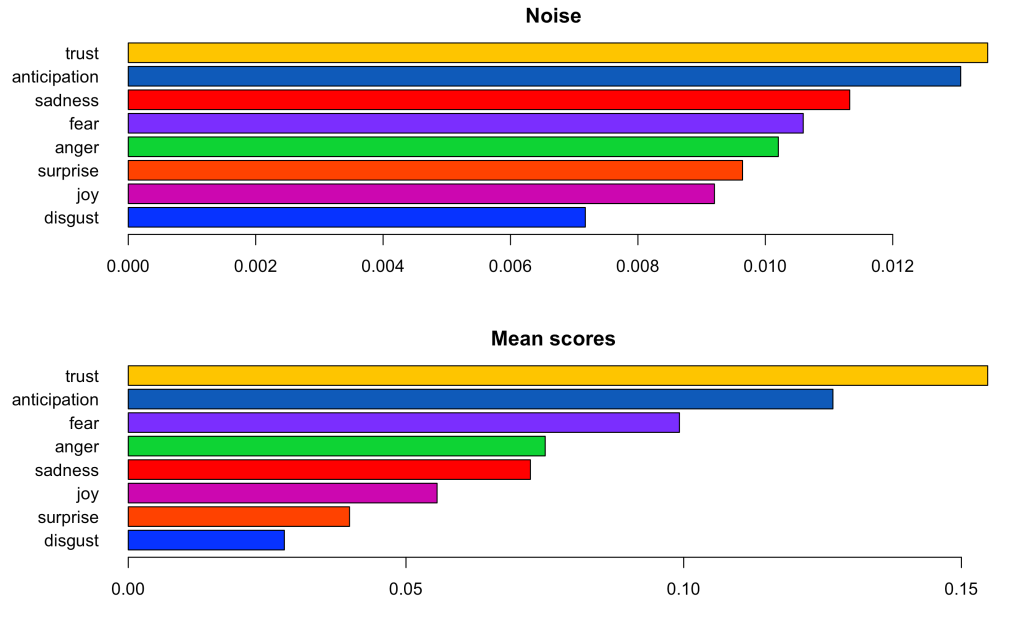
By looking at the figures above and below, we can get an idea of how the ‘sentiments’ employed in google news behaved across a period of 30 days. The first thing we can notice is that most of the words kept a similar level across time, with some emotions having more noise than others (in terms of their standard deviation) and some emotions clearly being more common than others. This can be easily appreciated in the figure below, which overlays all of the distributions on top of each other.

From the data I was able to process, I am specially intrigued by the difference of noise (or variability) in the different emotions. For example, it seems like there was almost as twice as much variability in words labeled under ‘trust’ in relation to ‘disgust’ on a day to day basis. That is that while ‘disgust’ levels stayed more or so stable through the 30 days, levels of ‘trust’ tended to vary more throughout the study.
One of the most practical implications of this brief project is that it presents an objective way to describe the composition of news articles related to COVID-19 & climate change during the past 30 days.
- 2.81% disgust
- 3.98% surprise
- 5.56% joy
- 7.24% sadness
- 7.50% anger
- 9.92% fear
- 12.68% anticipation
- 15.47% trust
In order to validate my findings further, it would be beneficial to compare these statistics to more news queries, which would tell us how COVID-19 and climate change is actually seen in relation to other news headings. Alternatively, these findings could be the first step in a longitudinal study that tracks changes across a longer span of time. While this is a very interesting topic in which there are a lot of topics to be researched, this post was mostly focused on implementing a machine learning model to measure humans behaviour and I can not really extrapolate any conclusions without comparing it to other queries.
