
In finance, technical analysis is an analysis methodology for forecasting the direction of prices through the study of past market data, primarily price and volume.
While there has been a lot of attempts at accurately predicting the financial market, most of them have been futile due to a simple reason. The market is ran by people and people are unpredictable. Similarly, a lot of these attempts are focused on finding trends across multiple days, using techniques such as moving averages and even some machine learning algorithms such as SVM, neural networks and random forests. In this post I propose a new method to approach forecasting, looking in a smaller time frame (such as a couple of days or a week) and shifting the question from “What will the price be?” to “Should I buy in this moment?”.
By looking at smaller time frames I hope to ‘smooth’ the price curve, which will hopefully reduce the height of some of the ‘spikes’ we see in financial plots and make it more ‘predictable’. In the framework I developed, I was able to fetch financial data in intervals of ~15 minutes across the days the market is open. Similarly, by focusing on whether it is a good moment to buy a stock rather on forecasting an approximation of the price we are changing the nature of the question to a binary decision. Now that we have a classification problem, there is a lot of different modelling techniques that specialize in these tasks. My method is structured in a very similar way to which a single layer perceptron is built.
In machine learning, the perceptron is an algorithm for supervised learning of binary classifiers. A binary classifier is a function which can decide whether or not an input, represented by a vector of numbers, belongs to some specific class. It is a type of linear classifier, i.e. a classification algorithm that makes its predictions based on a linear predictor function combining a set of weights with the feature vector.
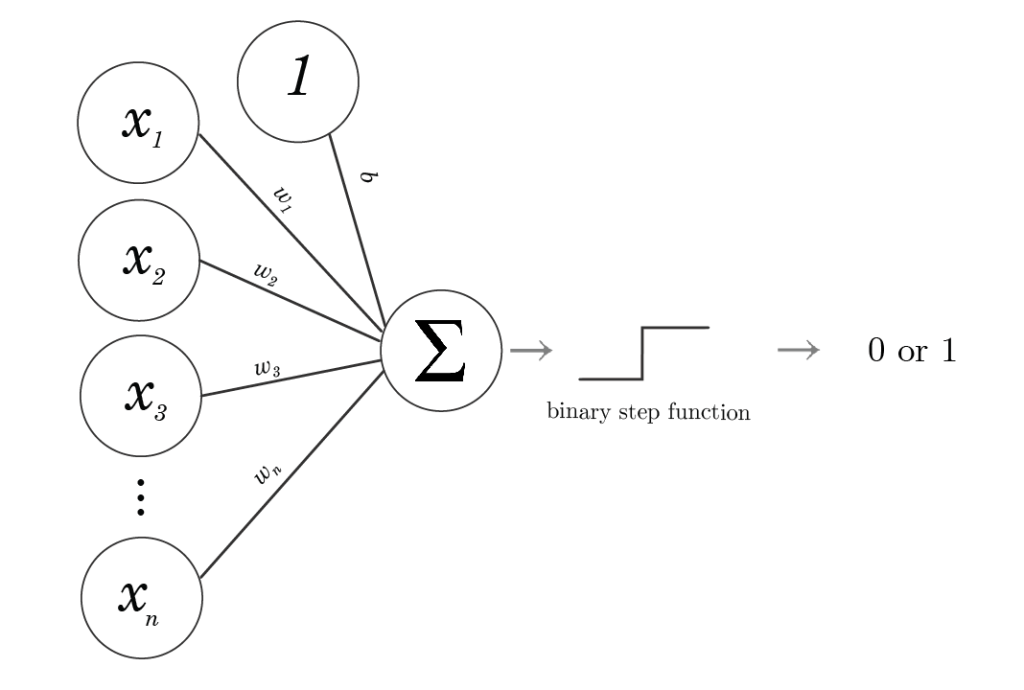
My model is made up by ‘units’ (often referred to as neurons), which take a combination of different inputs and give a logical output, that is each unit either gives a TRUE or a FALSE. All of these logical outputs then get processed by a buffer at the end of the network which ultimately determines whether it is a good moment to buy or not. All of these different ‘units’ have different purposes. For example, some of them check that:
- The price is below a custom limit threshold
- There is not a huge delay between the processing and the actual trade time
- Other stocks that intercorrelate are within desired standards
- The trend of the overall financial market is overall favourable
- There aren’t any odd relationships between the inputs
- The price is likely to rise
- Decisions that have been wrong are placed on hold until there is a different trend
These rules are supervised by a variety of tools, such as simple linear regression, probability density functions, neural networks, graph theory, etc.
We can also apply this methodology by automating it and placing it in a loop, and uploading our model to a virtual machine in a server. This would allow us to constantly fetch financial data and simultaneously analyze it, which could be complemented by a notification system that can send alerts for purchase opportunities. Finally we can even make a scaled economy by applying this framework to up to 30 different stocks within the same server. This project is currently at its testing stage, but the results look promising.
